Today in chemistry we did a lab that tested the colligative properties. In the lab we boiled a solution of water and an unknown substance to its boiling point. We used four beakers that were each filled with about 50 ml of water. The first beaker was the control group so we didn't add any of the substance. In the second beaker we added about 5 grams of the substance and for the third and fourth beakers, we added about 10 and 15 grams respectively. While the solutions boiled we placed a thermometer inside the beaker to find its boiling point. As expected, the solution's boiling point got higher with a higher concentration of the substance. For the first calculation, you will want to use this equation:
T(b)=i x m x k(b)
You are supposed to solve for molality here. The ionic solid has 2 ions so i would equal 2. m would equal the molality and k(b) is a constant, which would be 0.51 for water. The T(b) is the Delta H that comes from the data in the lab. The homework is to finish up the post lab which is due on friday. Also there are 3 WebAssigns due on friday so keep up with them. The next scribe is Lauren C.
Wednesday, March 23, 2011
Tuesday, March 22, 2011
Colligative Properties
Today in chemistry we kicked off class with a lecture regarding colligative properties. There are 4 types of colligative properties and they are:
1.Vapor Pressure Lowering
2. Boiling Point Elevation
3. Melting Point Depression
4. Osmotic Pressure
Basically, the relations are simple. The more solute added, the more the vapor pressure decreases. The more solute added, the more the boiling point raises. The more solute added, the lower the melting point becomes. We also got a few formulas to accompany the above.
To calculate the change in boiling point(Blogger isn't letting me use equation editor, get notes off moodle to really see this):
Change in Boiling Point=molal boiling point elevation constant x molality
Traingle T subscript b= K subscript b * m
To calculate freezing point depression, you use the same formula except the constant is different. The K subscript b is repaced with K subscript f.
The van't Hoff factor basically mens that if you have a mole of NaCl, and the ions dissociate when in water, you will get one mole of Na+ ions and one mole of Cl- ions. The van't Hoff factor is i so simply modify the previous equations by multiply i to the end like so:
Triangle T subscript f= K subscript f * m * i
That pretty much sums it up for new material covered today. Liebs demonstrated these new concepts with one demo involving 4 of us as water molecules, showing that the more solute added (balloons), the more interactions we had to make with it (touching each ion), which made it harder for us water molecules to turn into our gaseous state. Also, we took some club soda, stuck it into some ice and upon opening the glass, thus releasing the CO2 which had raised the freezing point, the club soda immediately froze.
Liebs also discussed some issues with the faulty Webassign that was due today, and said he would make corrections. I know it probably frustated myself as much as did to some of you (honestly, comment if you remembered how to use sig figs before this unit started).
That's about all though. Homework tonight is to do all the worksheets you have been given this unit that are due on the day of the test, as well as the 3 remaining webassigns also due on the day of the test.
Justin J., come on down, you are the next contestant on the price is right.
Monday, March 21, 2011
Stoichiometry Returns
Today in 7th period chem we did some stoichiometry with solutions.


That was one problem that we did. Basically you can use mole ratios from a balanced equation, molar masses, and now you can use the molarities to get what you want.
Now we know the mole ratio is related in several ways:
-PV=nRT
-molar mass
-M=moles/L
We can use stoichiometry for pure substances, gases, and now solutions.
If anyone is still having trouble, I would recommend going through the notes from last semester on Stoichiometry, or watch this video:
http://www.youtube.com/watch?v=uiEc5LcsGIg
(my blogger never lets me put the actual video in... :( )
The next scribe will be...... Nicole C
Sunday, March 20, 2011
Hey Guys! So today in chem class we went over notes on molarity and molality dilution.
The first concept that we talked about was the concentration of solute. That is, the amount of solute in a solution is given by its concentration. There are four units if concentration.

The first is molartiy and you can compute it by this equation, molarity (M) = moles of solute/liters of solution. This equation comes in hand when you are trying to figure out the mass of a substance needed to make a certain amount of solution at a specific molarity, or to simply find the molarity of a solution.
The second unit in with you can compute the concentration of a solution is molality, be sure to not get this and molarity confused for the sound very similar. With this unit the equation is molality (m) of solution moles of solute/kilograms of solvent.
The third unit in with you can compute the concentration of a solution is percent by mass. The equation of this unit is % by mass = (grams of solute/grams of solution) X 100.
The fourth and final way of compute the concentration of a solution is by finding the mole fraction. To find this you use the equation mole fraction (x) = moles of solute/ moles of solvent + moles of solution. For this you want to remember to have your final answer be in decimals.
The second concept we discussed was molarity and dilution. This concept talked about diluting a solution and this is simply adding more solvent, in our case water, to the solution. This will dilute the solution but remember that the amount of solute does not change and because of this, it is really easy to calculate the new molarity. All you do is take the information you have (at least three points) and plug it into the equation, MaVa=MbVb.
That was all for today’s class. Homework for Monday is to finish your lab and do the webassigns also remember to keep up with your work sheets.
The next scribe is …………………….. Rachel M.
Thursday, March 17, 2011
Solubility Curve Lab

Today in 7th Period Chem we did yet another lab! This one dealt with measuring the saturation temperatures for six difference solution concentrates to construct a solubility curve.
The lab itself wasn't too complicated. Each lab group had 6 test tubes: 3 for Series 1 and 3 for Series 2. The first step was to mass the empty test tubes and record that in the lab table. Next, we added potassium nitrate to each test tube: each test tube had a specific amount of potassium nitrate it needed to be added [the lab direction sheet explains the specifics]. Once that was done, we massed the test tubes with the potassium nitrate and added that in the data table. The next step was to add 20 drops of distilled water into each test tube. Then -you guessed it- we massed the test tube plus potassium nitrate plus water....and added that into our data table. Finally, we placed the test tubes in a hot water bath, letting the potassium nitrate dissolve, then put the test tubes in an ice water bath. This cooled the solution which enabled it to crystallize. We took note of the temperature the instant crystallization occurred and recorded that into our lab table.
With all this information, there were some things that needed to be calculated in the lab. The calculations were quite simple- you just needed to use your data.
1. Calculate the mass of potassium nitrate and the mass of water in each solution
For the mass of potassium nitrate, you take the mass of test tube and KNO3 and subtract it by the mass of the empty test tube. So essentially, the second column of your data table minus the first. You have to do that for all 6 of the test tubes, so it gets pretty tedious.
For the mass of water, it's the same idea. Subtract the mass of test tube plus KNO3 and water by the mass of test tube and KNO3, which is really column 3 in your data table minus column 2.
2. Calculate the ratio of the mass of potassium nitrate to the mass of water for each solution
Here, you take the values you got from part one and set them to a ratio. For each of the 6 test tubes, divide the mass of potassium nitrate by the mass of water. That will be your ratio.
3. Multiply each ratio by 100 to get the solubility in g/100g of solvent
This one speaks for itself. Multiply what you got in in part two by 100 and you're set.
So that's the gist of the lab and the calculations. After you do that, all you have to do is place ALL of the results in a results table and plot a graph of solubility of potassium nitrate!
This lab is due Monday.
Other than that, we have a Webassign due tomorrow as well as the usual worksheets that will be due at the end of the unit.
That's all I've got for today. The next scribe will be.............................................NIRALI P! Good luck :)
Wednesday, March 16, 2011
Baby Monkey Going Backwards on a Pig
What a great day in 7th period chem. Arguably the best day of the year. It started out with a discussion about the english mini field trip. Summarized to be "the english teachers needed three periods to assign a project that we all knew we had." Once all of our shenanigans ended, the real chemistry began. We discussed the concept that pressure and temperature both effect solubility.

Container A is under normal pressure and therefore has a normal solubility. Container B is under high pressure and therefore has a higher solubility.

As this graph shows, when the temperature increases, so does the solubility. It is the opposite effect for gases in solution. Ce2(SO4)3 is a hipster.
We then discussed saturation. When the solubility is even with the line on the graphs, the solution is saturated. When there is less solubility than possible, the solution is under saturated. Super saturation comes when a solution is saturated at one temperature, and then is cooled down. This video shows what happens when a super saturated solution is agitated.
This is a video of a baby monkey riding backwards on a pig.
Remember to do the lab. And keep up with your webassigns.
Nicole C can do the next post. Your welcome Nicole.
Tuesday, March 15, 2011
Solution Formation Lab

In the shortened period today we did the Solution Formation Lab. The goal of the lab was to determine the effect of three variables on the solubility of copper sulfate in water. These variables were: crystal size, temperature, and degree of mixing. Based on my group's (Trevor B, Artie B, and myself...decide if you trust us or not) data, we came to the conclusion copper sulfate was most soluble under the following conditions:
- higher temperature
- smaller crystals
- and vigorous stirring
Conversely, the least soluble conditions are:
- lower temperature
- larger crystals
- and little to no stirring
And that's about it for today. Work on your Webassigns and the lab writeup is due Thursday. Until we meet again,
Declan G.
Joining you tomorrow will be the notorious Arthur B
Monday, March 14, 2011
Solution Chemistry Day 1
Today we started our new unit on Solution Chemistry. He handed out a new calendar and a new objective sheet. He then gave us the new notes (not online anywhere). We began the period by looking over tests that we took last week. We made another mighty fine discussion and some good laughs courtesy of the usual people. We began our notes discussion with the definitions:
Solution: a homogeneous mixture (all one colored M&M's)
Solute: is dissolved in the solvent
Saturated solution: is one where the concentration is at a maximum, no more solute is able to dissolve.
Supersaturated: a solution that is made at a higher temperature, and when it cools there is more solute than if it were only saturated.
Mr. Liebs then did a sweet demo of how H2O molecules would break dissolve a Salt (NaCl). The two substances would go through three process's before they would become a solution.
-Separation of the solute: the molecules overcome their IMF, using energy (endothermic)
-Separation of the Solvent: the molecules overcome their IMF, using energy (endo).
-Interaction of solute&solvent: attractive form between solute particles and solvent particles. "solvation"or "hydration" (water=solvent)
We had a brieft discussion about how like molecules disolve like molecules. That was the end of our discussion for todays class.
The NExt Scribe is Declan G
Wednesday, March 9, 2011
Intermolecular Forces
Today was all about intermolecular forces. The first type is called a dispersion force. Dispersion forces are weakest type of intermolecular force, and it is present in every molecule. Dispersion Force also depends on the molar mass of a substance.


The second type of intermolecular force is Dipole forces. Every polar molecule has dipole forces. Since polar molecules have a negative and positive ends, dipole forces cause polar molecules negative ends to attract the positive ends of other molecules and then another molecule will attach and so on.
The third type of intermolecular force is Hydrogen Bond forces. Hydrogen Bonds are basically the same concept of dipole forces, where the negatives attach to the positives, but these forces are a lot stronger. However there is a catch, hydrogen bonds can only happen when a hydrogen bonds to a N, O, or F. These three atoms have the highest electronegativities, so they will create very very polar molecules. A great example of hydrogen bonds is H2O. The intermolecular force in water is great because of the hydrogen bonds. Because the forces are so great, it can cause water to stick together, or bead. These hydrogen bonds are the reason for these to events....
Today we also did a lab exploring the effects of intermolecular forces. These effects include...
-Evaporation Rates
-Capillary Action (A Liquids tendency to climb up the walls of a narrow column)
-Vortex Formation and Relaxation (The time it takes for a liquid to relax after swirling it)
-Viscosity (Resistance to flow)
-Surface Tension (Property shown by water in above photo of the water drops on the penny)
-Beading (Shown in the above picture of the water)
The homework for today is to keep up with the webassigns. There is a reading sheet due tomorrow and all the other HW WAs are due friday. The Lab is also due on friday
The next scribe is....STUART P. Good luck bud
Non-Polar Vs Polar Molecules
The main idea today in class was non polar vs polar molecules.....


Non Polar Molecules
Non polar molecules have symmetry (the charge is evenly spread throughout the molecule) They dont have a positive and negative side. Non Polar molecule NEVER have NON BONDING PAIRS. Non bonding pairs would give the molecule a higher concentration of negative charge on one side, making it polar. It is possible for non polar molecules to have polar bonds, so be careful when determining wether or not it is non polar, its all about the symmetry.
These 2 molecules (CCl3 & BF3) are non polar because the charge is evenly distributed. SYMMETRY!
Polar Molecules
Polar molecules do not have symmetry, they have negative and positive ends. This could be causes by non bonding pairs, which will cause a molecule to have a high concentration of negative charge on one end. It could also be caused by a molecule with more than 2 different atoms around the central atom, one of them having a higher electronegativity will cause more negative charge concentration on one side making it POLAR. A great example of a polar molecule is H2O, or water. Since O has a higher electronegativity then H, all the negative charge concentrates around the O. This causes the O side of this molecule to be negative, and the H side, to be positive. Here are some pictures of Polar Molecules...
Liebs did a demo to show the polarity of water. He had a balloon and he rubbed it against his head. This caused the balloon to take a negative charge. There was also a stream of water dripping from a glass cylinder. When liebs put the balloon close to the water, the water bends towards the balloon. What actually happens is the positive side of the H2O molecule (the H side) is attracted to the balloon. Hopefully now you know more about polar and non polar molecules....
The HW is to make sure you are keeping up with the webassigns
Monday, March 7, 2011
Polarity
A polar molecule is caused caused when the difference in the electronegativity of an atom is between .4 and 1.7. If the difference is between 0 and .4 then the molecule is not polar. In a non-polar molecule the electrons are equally shared between the two atoms that are bonded together. in a polar molecule the electrons are unevenly shared between the atoms that are bonded together. In the bond one of the atoms tends to be negatively charged and the other tends to be positively charged.
One example of a molecule that is not polar is C-C. This molecule is non-polar because the difference in electronegativity of the two atoms is zero.
An example of a polar molecule is C-F. This molecule is polar because the difference in electronegativity is 1.43. Since it is polar the fluorine atom pulls harder on the electrons in the bond then the carbon and thus is partially negative while the carbon is partially positive. The electrons in this covalent bond are still being shared just not 50-50 between the two atoms.
The next scribe is.....Amar B.
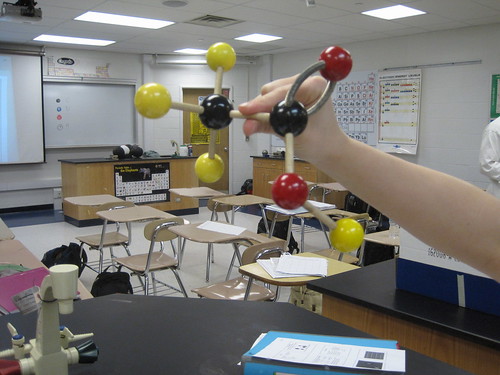
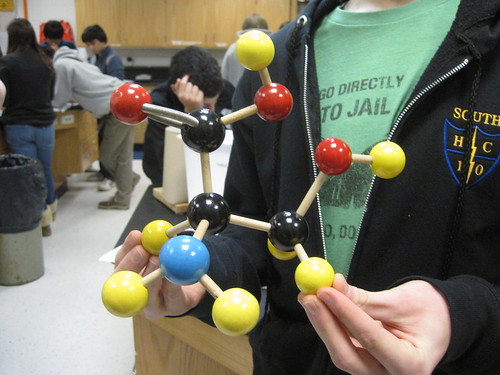
Building the Big Ones
Today in class we did our first lab of the new unit. This lab was show students what a molecule with more then one central atom would look like. The molecules we had to build in the lab were, ethanol, acetic acid, serine, and styrene. Each molecule has a very unique shape to it and has many central atoms. In the pictures below black represents a carbon atom, yellow is hydrogen, red is oxygen, and blue is nitrogen. 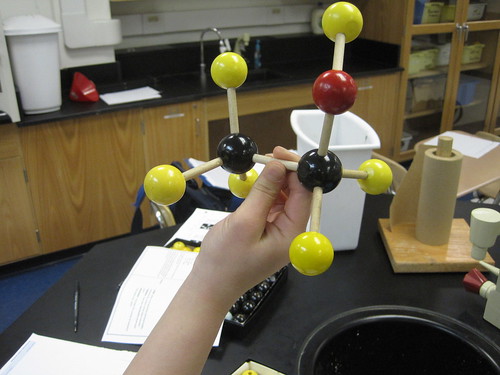
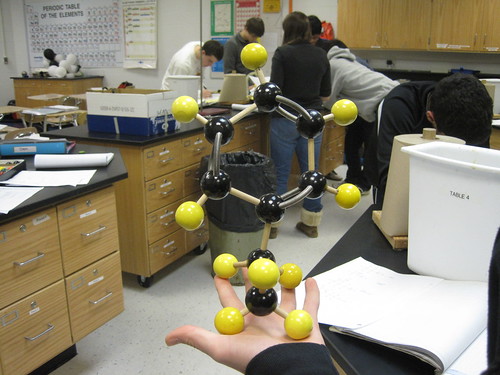
This atom is ethanol and is comprised of two carbons, six hydrogens, and one oxygen, with the carbons and oxygen being the central atoms.
In this photo is the acetic acid molecule. It is made up of two carbons, four hydrogens, and two oxygens. In this molecule the carbons and one of the oxygens are the central atoms. Also in this molecule the metal springs connecting the carbon and oxygen atoms represent a double bond.
This molecule is serine. It has three carbons, seven hydrogens, three oxygens, and one nitrogen. The three carbons, two of the oxygens, and the hydrogen are the central atoms.
The final molecule is styrene. This molecule has eight carbons, and ten hydrogens. All eight of the carbons are central atoms.
Wednesday, March 2, 2011
VESPER 2
Before I begin I just want to thank to Chris that he made me scribing tonight. This is so fun....
Today we learned VESPR of five and six electron pairs
for five electron pair, there are three type of possible shapes they can be
The first one we learned today was
known example as PF5
does not have nonbonding electron
somehow I can`t put picture sorry
next
ex; SF4
has one nonbonding electron
ex; ClF3
has two nonbonding electrons
those are five electron pairs
and
here is six electron pairs
does not have any nonbonding electron
known as SF6
has one nonbonding
ex; ClF5
has two nonbonding electrons
ex; XeF4
has three nonbonding electrons
ex; XeF2
here is the list
this might have some extras but doesn`t matter
thank you and next scribe will be..... TREVOOOOOOOOR brrroowwn
have funnn
Tuesday, March 1, 2011
Valence Shell Electron Pair Repulsion, and how it affects the structure of Atoms.
To start off, we need to make clear that electrons always come in pairs, and that their are two different types of pairs.
1.The first of these are Bonds.
2.The second are Non-Bonding pairs.
Both of these will affect the Structure of our molecule, but the only part of the structure we see are the bonded Pairs. This will make more sense whence you understand the Valence Shell Electron Pair Repulsion (VSEPR) rule. Under VSEPR electrons pairs in the outermost shells will attempt to go as far away from each other as possible. This means that although we don't look at the Non-Bonding electrons in the structure, they still are Under VSEPR and are effecting the shape of the electrons.
Although it is called Electron Pair Repulsion, we are not simply looking at the pairs, we are looking at areas of electron. I mean to say that if we were to encounter a double bond between two atoms, we would not expect the two pairs involved in the bonding to repel each other. No, these Double Bonds and triple bonds stick together.
In drawing the shape of Atoms we look at the number of Electron Areas around the Central Atom. A different structure is given based on how many electron Area's are around the central Atom and how many of these Areas are Bonds or Non-bonding Pairs. The Notes did a very good job of going through these types but because I do not have access to them, I'll go through it with you now.
Linear is the structure given when their are only two Electron Areas surrounding the central atom and both are Bonds. The atoms are exactly 180 degrees from each other. This structure looks like this
Trigonal Planar this structure happens when the central atom has three electron Areas and all three are Bonds. The atoms still all fit on a plane and are all 120 degrees from eachother. This structure looks like so
Bent Molecule This happens when their are only two Bonds, like Linear, but the central atom also has A non-bounding pair. This causes the atoms to remain 120 degrees from eachother but we only see two of the atoms, and we see a bent structure like this
Tetrahedral Molecules get a little more complex because they now become three dimensional. When their are four electron areas, the atom seperates every atom by 109.5 degrees to look like so
or when drawn on paper it looks something like
Triangular Pyramid when one of the four electron areas is a non-bonding pair it looks something like this

If two of the four electron ares are Non-Bonding then we see another Bent Structure, but in this case it is slightly more tight of an angle creating about a 104 degree bent.
Well there you have the atom structures that we have learned so far. No homework tonight but try to keep on track of upcoming webassigns. thank you, the next scribe will be
Takashi, have fun.
1.The first of these are Bonds.
2.The second are Non-Bonding pairs.
Both of these will affect the Structure of our molecule, but the only part of the structure we see are the bonded Pairs. This will make more sense whence you understand the Valence Shell Electron Pair Repulsion (VSEPR) rule. Under VSEPR electrons pairs in the outermost shells will attempt to go as far away from each other as possible. This means that although we don't look at the Non-Bonding electrons in the structure, they still are Under VSEPR and are effecting the shape of the electrons.
Although it is called Electron Pair Repulsion, we are not simply looking at the pairs, we are looking at areas of electron. I mean to say that if we were to encounter a double bond between two atoms, we would not expect the two pairs involved in the bonding to repel each other. No, these Double Bonds and triple bonds stick together.
In drawing the shape of Atoms we look at the number of Electron Areas around the Central Atom. A different structure is given based on how many electron Area's are around the central Atom and how many of these Areas are Bonds or Non-bonding Pairs. The Notes did a very good job of going through these types but because I do not have access to them, I'll go through it with you now.
Linear is the structure given when their are only two Electron Areas surrounding the central atom and both are Bonds. The atoms are exactly 180 degrees from each other. This structure looks like this
Trigonal Planar this structure happens when the central atom has three electron Areas and all three are Bonds. The atoms still all fit on a plane and are all 120 degrees from eachother. This structure looks like so
Bent Molecule This happens when their are only two Bonds, like Linear, but the central atom also has A non-bounding pair. This causes the atoms to remain 120 degrees from eachother but we only see two of the atoms, and we see a bent structure like this
Tetrahedral Molecules get a little more complex because they now become three dimensional. When their are four electron areas, the atom seperates every atom by 109.5 degrees to look like so
or when drawn on paper it looks something like
Triangular Pyramid when one of the four electron areas is a non-bonding pair it looks something like this
If two of the four electron ares are Non-Bonding then we see another Bent Structure, but in this case it is slightly more tight of an angle creating about a 104 degree bent.
Well there you have the atom structures that we have learned so far. No homework tonight but try to keep on track of upcoming webassigns. thank you, the next scribe will be
Takashi, have fun.
Where are all my electrons?
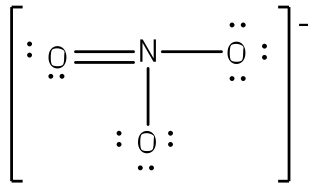
When drawing lewis structures we may sometimes run into a problem. One such problem arrises in the drawing of SO2. SO2 has one single bond and one double bond. We could just give one Oxygen Atom a single bond and one Atom a double bond, but this would not be accurate. The reason is because the electrons that form these double bonds are constantly vibrating between the two Oxygen Atoms. A more appropriate way to draw the Lewis structure would be using it's resonance structure, which looks like so


A double headed Arrow separates the two lewis structures letting us know that if we were to take a snapshot of the atom at any given time, it would look like one of these two diagrams.
One other point brought up in class today was Ions. Ions are slightly more complex to draw in a Lewis, structure, but fortunately not too complex. Their are two main steps that are need to remember.
1. The first is that the molecule is not neutral and therefore has either more or less electrons. If the Ion has a charge of 2-, then it has two extra valence electrons.
2. The second difference between these and neutral molecules is that you must bracket in your entire Lewis structure and write the charge of the Ion outside of the brackets at the top right, as you would for a power of.
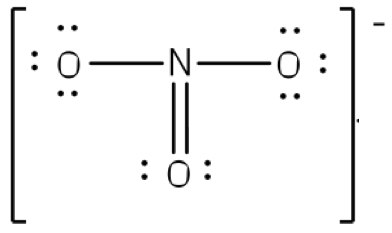
To put both lessons together, the following shows the Resonance structure of the Ion NO3(-)
A double headed Arrow separates the two lewis structures letting us know that if we were to take a snapshot of the atom at any given time, it would look like one of these two diagrams.
One other point brought up in class today was Ions. Ions are slightly more complex to draw in a Lewis, structure, but fortunately not too complex. Their are two main steps that are need to remember.
1. The first is that the molecule is not neutral and therefore has either more or less electrons. If the Ion has a charge of 2-, then it has two extra valence electrons.
2. The second difference between these and neutral molecules is that you must bracket in your entire Lewis structure and write the charge of the Ion outside of the brackets at the top right, as you would for a power of.
To put both lessons together, the following shows the Resonance structure of the Ion NO3(-)
 |  | |
Thursday, February 24, 2011
Covalent Bonding
Today's topic was covalent bonding. Covalent bonding is bonding between two non metals. In covalent bonding an electron is not lost or gained by an atom or molecule but rather shared between them in bonds.  F2 is a very simple example of a covalent bond. They share electrons with each other.
 F2 is a very simple example of a covalent bond. They share electrons with each other.
 Fluorine only has a single bond. Molecules can have up to triple bonds and can have crazy shapes and patterns depending on what is being bonded and how many are being bonded.
In class we also went over how we can represent covalent bonds in diagrams. One in the pic above is the simpler of the two the other however helps a lot later on when getting into representing bigger molecules. The Lewis Structure.
We got a set of guidelines on how to make a Lewis structure.
1) count the total number of valence electrons and include any ions (+) or (-)
2) Predict the layout of the diagram. First atom listed in the formula is usually in the middle. Just be sure to remember that H can only be bonded to one other atom.
3) Find the number of valence electrons left over from forming the single bonds. Each bond counts as 2 electrons
4) Place the electrons around the outside atoms until each outside atom has 8 electrons around it. Just remember that H follows the duet rule. It only has 2 electrons.
5) Its OK to have more than 8 electrons around the central atom as long as it is the third row or lower on the periodic table. If there isn't enough electrons to put 8 around the central atom then go back and change some of the single bonds to double or triple bonds. C, N, O, and S are commonly know to form double and triple bonds.
Well that about covers everything we went over in class today. HW for today was the Lewis Structure worksheet.
Next scribe is Chris.
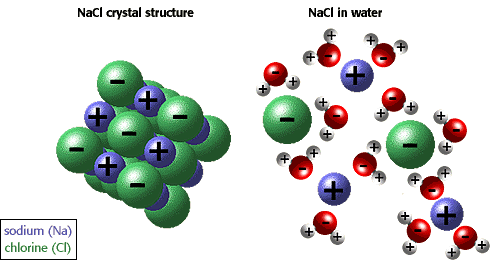
Ionic Bonding
Wednesday our class went over ionic bonding. This is the bonding between a metal and a non metal. The main thing in this concept is the Valence electrons. These electrons are what make up the outside energy level.
Ex. 1s22s22p5 The valence electrons for this would be the 2s2 and the 2p5 for a total of 7 valence electrons.
We learned that ionic bonding includes 3 steps: 1) Loss of a e- 2) gain of an e- 3) the atoms or molecules attract.

We also went over how to create a Lewis Diagram as seen on the pic to the right.
The diagram to the right is a lewis diagram of Sodium Chloride. The Sodium wants to get a full energy level and the easiest way to do that is by dropping an electron. The chloride molecule on the other hand wants to get a full energy level by gaining and electron. That is the easiest way for it to get to a full energy level.
That's about all we covered for Wed.
Thursday, February 17, 2011
Periodicity
Today during class we discussed the trends that have recently appeared in the organization of the Periodic Table. Using the graphs we created the previous day, we looked at Ionization Energy and Atomic Radius in relation to the elements, and their organization in periods and groups.
1. First Ionization Energy (the difficulty of losing one electron--first level)
--As you move top to bottom in groups, it is easier to lose electrons, therefore the first ionization energy decreases. This is because as you move further down, there are more levels of electron orbitals, and they are easier to loose the farther they are from the nucleus
--As you move left to right in periods, it becomes harder to lose electrons, therfore the first ionization energy increases. This is because as you move across left to right the atomic number increases therefore so do the number of protons, which means there is greater pull on the electrons you are trying to lose.
2. Atomic Radius (size)
--As you move top to bottom in groups, the atomic radii increase. This is because there are more levels surrounding the nucleus, therefore larger atoms
--As you move left to right across the periods, the atomic radii decreases. This is because as you move across periods, the atomic numbers increase, and therefore so do the number of protons in the atom. The greater number of protons, the larger pull on the electron orbitals. The greater the pull on the orbitals, the closer they will be pulled into the nucleus, in turn the atoms will be smaller.
Next Scribe...
Rachel Mann
Tuesday, February 15, 2011
orbital diagrams
today during class we learned how to write the short version of an electron configuration and how to make an orbital diagram. to write a short-hand electron configuration, you write the symbol of the closest noble gas before the element in brackets and then you write the rest of the configuration as normal.
ex: for potassium it would be [Ar] 4s*1
we also learned about orbital diagrams and how to write them. lieberman explained to us how in an orbital diagram you should always write the arrows from left to right and all of the spaces in the sub-level fill up with one first and then you fill the second part when they all have one inside. if you have any questions Mr. Lieberman's email is: dlieberman@glenbrook225.org.
ex. (↑↓) (↑ ) (↑ )
The Next Scribe is...
Bailey M.
Saturday, February 12, 2011
Electron Configurations
So today in class we had quite a long, and somewhat decieving, lecture by Mr. Lieberman.
We learned how to find the electron configurations for neutral elements. The first sublevel s can only hold two electrons, therefore, if the electron is completely filled at this level, the equation would read: 1s^2. The superscript (or exponent) tells you the element. Since the exponent is 2, the element would be Helium. Once a sublevel has been completely filled, if another electron is added, then a new sublevel begins to fill. If this sublevel is completely filled, then the equation would read, 2s^2. Now, this is where it gets tricky. In order to be able to identify the element, you must add this exponent to the exponent in the previous sublevel(s). In this case, 2 from the first sublevel and 2 from the second sublevel gives you 4 electrons. Now you are able to identify the element, which would be Beryllium. Energy sublevels continue to be filled and you add the exponents the same way to find the element.
A further explanation from the book might help you understand this.
- The elements in groups 1 and 2 on the Periodic Table are filling an s sublevel. Thus, Li and Be in the second period fill the 2s sublevel. Na and Mg in the third period fill the 3s sublevel and so on.
- The elements in groups 13 through 18 (six elements in each period) fill p sublevels, which have a capacity of six electrons. In the second period, the 2p sublevel starts to fill with B and is completed with Ne. In the third period, the elements Al through Ar fill the 3p sublevel.
- The transition metals, in the center of the periodic table, fill d sublevels. Remember that a d sublevel can hold ten electrons. In the fourth period, the ten elements Sc through Zn fill the 3d sublevel. In the fifth period, the 4d sublevel is filled by the elements Y through Cd. The ten transition metals in the sixth period fill the 5d sublevel. Elements 103 to 112 in the seventh period are believed to be filling the 6d sublevel.
- The two sets of 14 elements listed separately at the bottom of the table are filling f siblevels with a principle quantum number two less than the period number. That is... 14 elements in the sixth period (elements 57 to 70) are filling the 4f sublevel.

An example of an equation we did in class is as follows:
1s^2 2s^2 2p^6 3s^2 3p^6 4s^2 3d^10 4p^6 5p^2 6s^2 4f^14 5d^10 6p^6
The subscripts tell you the energy level, the letters tell you the orbitals, and the exponents (or superscripts), when added together, tell you the electrons. If you were to add all the exponents in this equation, the number would be 86, which is the element Rn (radon).
The next scribe is...
Matt B.
Quantum Numbers
 On Thursday we got some new class notes. We talked about the Quantum Mechanical Model and Quantum Numbers.
The Quantum Mechanical Model describes the electronic structure of the atom as the probability of finding electrons within certain regions of space (orbitals). Remember that in the orbital or "electron cloud" there is only about 90% probability of finding an electron within the orbital. Also, according to Heisenberg's Uncertainty Principle, it is impossible to know both the velocity and position of an electron at the same time.
Some things you should know about Quantum Numbers:
- They are used to specify the "address" of each electron in an atom.
- No atom has the exact same quantum number as another atom, they are all unique (refer to the stadium model in the notes).
- There are four quantum numbers:
Principal Quantum Number (n) which is the most general #. It tells us the energy level and sixe of the orbital. Note: These numbers can only have integral values, and the must be positive.
Angular Momentum Quantum # (l) which tells us the enegry sublevel, type of orbital, and shape of orbital (s, p, d, or f). The value of l has integral values from 0 to n-1, and is related to the shape of the orbital. l=0 is s orbital, l=1 is p orbital, l=2 is d orbital, l=3 is f orbital.

Magnetic Quantum Number (ml) tells us the orientation of the orbital, specifies the exact orbital within each sublevel, and has values between l and -l.
Spin Quantum Number (ms) has an electron spin of either -1/2 or +1/2. An orbital can hold two electrons as long as they are spinning in opposite directions. 
That pretty much covers what we learned on Thursday. The next scribe is me again, since I forgot to scribe today.
Wednesday, February 9, 2011
Light
Hello
Today was a simple class. We just went over the notes.
First we talked about the wavelengths and frequencies of different types of light.

The types of light on the left side of the electro magnetic spectrum have a high frequency and small wave length. The types of light on the right side have a low frequency and a large wavelength.
As the frequency goes up, the wavelength goes down.
Mr. Lieberman used an example. If you are standing on an overpass looking down at two lanes, one of which has semi trucks in it and the other has sports cars in it, the lane with the sports cars will have a higher frequency because more cars can pass by in a given amount of time. The lane with the semi trucks in it will have a lower frequency because less trucks can pass by in a given amount of time, but will have a higher wavelength.
We then took out our cell phones and looked at the infrared light given off through the remote.
We then took out our cell phones and looked at the infrared light given off through the remote.
Then we learned about the equation for speed which is, wavelength(frequency)=speed.
We aslo learned about Planck. He stated that the transfer of energy is not continuous. His equation for change in energy is: change in energy=hv
h=Planck's constant= 6.626X10^-34 Js
A higher frequency=more energy
A lower frequency= less energy
Einstein stated that electromagnetic radiation was made up of a stream of particles known as photons.
A man named Louis de Broglie connected the two theories about light (that it was in wavelengths or in streams of particles) to make an equation: wavelength=planks constant/mass(velocity)
The last thing we did was put on 3D glasses and look at the lights on the ceiling. We a continous spectrum of light. After that Mr. Lieberman turned on a helium and mercury light and we saw a line spectrum.
Thats we learned about.
The homework is to do the top of the worksheet we got.
The next scribe is Erika
Wednesday, February 2, 2011
Tuesday, February 1, 2011
Spontaneous reactions, Entropy and Gibb
Hey everyone~
Sorry about not posting yesterday :(
But otherwise, i'll be explaining yesterday and today's day in Chemistry.
On Tuesday, Mr. Liebs explained Spontaneous Reactions and Entropy (\DeltaS).
Although it's all in our notes, I'll just summarize the basic points:
Spontaneous Reactions: a process that takes place on their own, without outside forces
Some examples are...
- ice cubes melting when added to water at room temperature
- mixing hydrogen and oxygen to form water when a spark is applied
- iron rusting because it's exposed to moist air
(These reactions will happen no matter what, in these given conditions)
Entropy
Nature tends to move spontaneously from an orderly state to a random/disorderly state (a process known as the randomness factor).
And connecting with this "randomness" idea is entropy: an increase in disorder or randomness shown as \Delta S
Entropy is highest in this order of states: solid <>
When using entropy in reactions, the equation is \Delta S =\Sigma \Delta S (products) - \Sigma \Delta S (reactions)
Note: when calculating entropy, the coefficients should be a part of the equation (multiplied to each term, accordingly)
On Wednesday, Mr. Liebs continued on with another explanation of notes on Gibb's Free Energy: the energy in the system that is available to do useful work.
A reaction can do useful work if it's spontaneous; and whether or not it's spontaneous can be found through this equation: \Delta G = \Delta H - T \Delta S (as long as temperature and pressure are constant)
Note: In the latter equation, 'T' or temperature has to be in Kelvin)
We will know if the reaction is spontaneous by knowing if \Delta G is a positive or negative value.
If \Delta G is negative, the equation is spontaneous
If \Delta G is positive, the reverse equation is spontaneous
[Look at Table 17.2 in the textbook for more information]
Homework:
Tuesday's homework: Hess' Law Lab
Hess' Law Worksheet
Wednesday's homework: Gibb's Free Energy Worksheet
WebAssign
AND THURSDAY'S TEST WILL BE MOVED TO FRIDAY BECAUSE OF THE SNOW DAY!
So have a fun snow day tomorrow! :)
And the next scribe will be....... Paige H.
Sunday, January 30, 2011
Hess's Law Lab
Friday was a pretty simple day in Chemistry. We started off class by going over the procedures for Hess's Law Lab. Here are some tips that might help you with the lab: When you are trying to find the heat of reaction for Reactions 1 and 2 you have to use q=mc∆t. Once you find J, all you have to do is divide that by 1000 to put it into kJ and then divide the kJ by the moles of magnesium/ magnesium oxide used in the experiment. Once you find the heat of reaction for both experiments, use Hess's Law to find the heat of reaction for the combustion of magnesium.
And the next Scribe is Rachel K.
Thursday, January 27, 2011
Hess' Law
The class started off today with Liebs showing us the experiment that failed yesterday. He was showing us how the process of sublimation could change to fusion. In order to do so he put frozen carbon dioxide, or dry ice, under "intense" amounts of pressure.
Once the dry ice melted under the water, it would pop under the pressure and send water everywhere, which was terrifying to some of the people in our class... so this is is the same thing, but without the "pop".
Moving onto the lecture today, we spent the rest of class discussing something called Hess' Law. Hess' Law basically says that you can use multiple ways to find Hess' Law, and it will still work, as long as you come to same, correct conclusion.
"If you ski down a hill, it doesn't matter the path you take, you're still going to get to the bottom. As long as you don't hit a tree."

Basically you are given a formula, and you must add and subtract a series of other equations to match it, and then do the same process to series' delta H's in order to find the original missing delta H. To change the equations you can do one of two things: you can flip the formulas around or multiply their coefficients by a number. When adding the equations, if they are on the opposite side of the arrow and the same element/compound they cancel. If they are on the same side then they combine.
An example:

Wednesday, January 26, 2011
If at Once you don't Succeed Try, Try Again.
That saying above doesn't apply for our class today. We were learning about Phase Diagrams:
 As you can see, the Liquid is on the bottom, the Solid is in the center and the Gas is on the top. (trust me the gas is there). The critical point is where the liquid is not a solid, liquid, or gas actually. I know it's hard to believe...but it's true. Liebs tried to show us that it was true with dry ice, but we couldn't get a good enough seal on the container so it didn't work. We tried to seal it many, many times but in the end all we had was a broken ego and a wish to see the critical point. So as you can see, 'if at once you don't succeed try, try again.' doesn't always work. But being as optimistic as we are, we will try it again tomorrow. So either it will work, or we will fail...again.
disappears and the point where liquid and gas are separated is nonexistent:

As you can see, the meniscus has disappeared.
Another thing we learned is the term Sublimation, this is when the solid changes to a vapor totally skipping the liquidation phase.
Please don't forget about the two web assigns. One has been extended from Monday, and is now due tomorrow, then also the web assign that is due on the 31st is up. We also have work sheets that are due on the day of the test.
The Scribe for tomorrow is...Erika G.!!!!!!!!! YAY!!!!! Good Luck Erika! And again sorry about the video, I'll figure it out by next time!!!!!
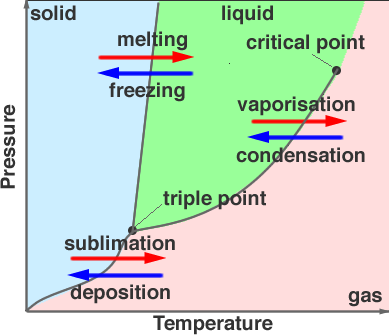
The Phase Diagram above is on Water!!! So the shaded blue part is where at a certain temperature and pressure the water is a Solid (such as Ice). The shaded green part is where the water is a liquid (Aka water). The shaded pink part (sure i guess you can call it peach) is the water as a gas. (The actual H2O molecule, not O2 or H2 molecules) Anyway...the places where the lines separate the three areas are where the change between the phases happen. The temperature is always on the X-axis and the pressure is always on the Y-axis. The lines tell the points at which the change takes place, but there is almost always a 'normal' melting or 'normal' boiling point. Which for water is 0 degrees Celsius and 100 degrees Celsius. The point on the graph that says "Triple Point" is where at this certain pressure and temperature the substance will be in all three states. We actually saw this happen in one of the demo's Mr. Liebs showed us... I couldn't find a picture of the triple point of nitrogen so I'll just use the picture of water...
As you can see, the Liquid is on the bottom, the Solid is in the center and the Gas is on the top. (trust me the gas is there). The critical point is where the liquid is not a solid, liquid, or gas actually. I know it's hard to believe...but it's true. Liebs tried to show us that it was true with dry ice, but we couldn't get a good enough seal on the container so it didn't work. We tried to seal it many, many times but in the end all we had was a broken ego and a wish to see the critical point. So as you can see, 'if at once you don't succeed try, try again.' doesn't always work. But being as optimistic as we are, we will try it again tomorrow. So either it will work, or we will fail...again. http://http//www.youtube.com/watch?v=2Z6UJbwxBZI&feature=related This video posted here (look up) is about the critical point of helium. (sorry i still can't get the video into the actual blog)
We were trying to do the same thing with carbon (aka dry ice) but as I said earlier we couldn't get a good enough seal. Also in the video you will hear the word Viscosity. That means the thickness or thinness of a liquid (also used for oils, if anyone needs to put oil in their cars they look at the viscosity to make sure it's right).
Boiling occurs when the vapor pressure and the pressure from outside are equal, or when the vapor presser exceeds that of the outsides. During the Critical point the meniscus:
disappears and the point where liquid and gas are separated is nonexistent:
As you can see, the meniscus has disappeared.
Another thing we learned is the term Sublimation, this is when the solid changes to a vapor totally skipping the liquidation phase.
Please don't forget about the two web assigns. One has been extended from Monday, and is now due tomorrow, then also the web assign that is due on the 31st is up. We also have work sheets that are due on the day of the test.
The Scribe for tomorrow is...Erika G.!!!!!!!!! YAY!!!!! Good Luck Erika! And again sorry about the video, I'll figure it out by next time!!!!!
Tuesday, January 25, 2011
Heat
Well, today was the second day of second semester. We started off class by having Mr.Lieberman show us how to do the graph for the lab we did yesterday. Basically when doing your graph you will beableto notice three distinct regions on the graph. These regions can be identified on the heat curve shown below.
As you can see the first region is where the snow(solid) turned in to water. The second region is just the liquid stage. After this stage there is the region where the water turned into steam. The first and third region are both endothermic. When we finished discussing this Mr. Lieberman told us of the possible error that we might find with our lab results. He said that for some of the data we might have gotten the temperature of the hot plate rather than the water. This would be if we let the thermometer touch the bottom of the beaker when recording the temperature.
When we finished talking about the lab, we worked on the worksheet that we picked up in class today. If you did not get it, you can get it on moodle. Also, if you finished the worksheet and want to review your answers you can get that on moodle as well.On this worksheet two new concepts were introduced, Heat of fusion and Heat of vaporization. The heat of fusion is used for the melting point, and the heat of vaporization is used for the boiling point. These can be found in our textbook.
Mr. Lieberman also did a demo today. Basically it proved if steam or liquid water could get hotter. To do this Mr. Lieberman burned a piece of paper only using steam. This helped to prove that vapor burns were more sever than liquid ones.
The next scribe is Danielle D. Have fun!
Monday, January 24, 2011
Heating Curve Lab
Welcome back! Today was the first day of the second semester. Besides getting new seats and some old work back, we also began a new lab. If you don't have it you can find it here (however this format is slightly different). We will no longer be using the pre-lab, data, post-lab format. The new outline for our labs is:
Title:
Lab Goal:
Data/Collections: (includes data, labeled graph, and percent error)
Conclusion: (includes claim (according to your data...), evidence (what data did you use
that helped you make this claim? How did you identify what ever you were
looking for), and reasoning (does your data make sense? Why might it not be
what you expected it to be?)
In the lab, we filled a 400 mL beaker with about 150 mL of snow/crushed ice. The goal of the lab was to find out the temperature at which ice melts and boils (using the heating curve). The next step was to take the initial temperature of the ice. My group got about -.5º C (however you should turn this number to Kelvin [add 273] because when calculating the percent error it will be difficult to work with Celsius whose freezing point is 0º).
Next, the beaker was placed on a hot plate and the heat was turned on halfway. The crushed ice was stirred and every minute it's temperature was taken. After all the ice melted the hot plate was turned on to full value. We continued to stir the liquid and take its temperature every minute. The hot plate was turned off after 3 minutes of boiling (100º C).
The data you got (temperature and time of the the different phases of the ice) will now be used to make a graph (recall earlier this year when we used excel to make tables and graphs with curves/lines). Instead of writing a post lab, you will write up a conclusion summarizing the lab and explaining at what temperature the ice melted and boiled at and why this is so.
That was about it for today. This lab is due wednesday. Our test will be next thursday (02/03/11). There is a webassign due tomorrow (tuesday the 25), and don't forget to start the second set of book problems which will be due on the day of the test. We will also be turning in the first set of book problems that we did before finals.
The next scribe will be Ann Marie C.
Good luck!
Monday, January 10, 2011
Heat of Formation Lab
Hey you guys! Today was basically a lab/work day. In the beginning of class we started by having Mr. Lieberman explain to us how to to the questions after the lab. If you don't remeber, or you didn't write them here it is:
Question 2. Use q=m x c x \Delta T
3. The equal opposite of #2 and convert into kilojoules
4. Do this in the same format as #2 from the pre-lab
5. Use 986.1 kJ as your theoretical amount
The lab itself was pretty easy to follow. After massing the the calcium metal, you had to place it in the calorimeter with aproximately 100 mL of water. After doing that a temperature had to be taken find the amount of heat created by the reaction. When everyone was done we did any work that we had not finished. All of this work will be turned in tomorrow. This includes 2 labs, 4 worksheets, book problems, and a webassign. For review here is a link to all of the notes we have done this chapter:
Thermo#1
View more presentations from gbsliebs2002.
Thermo#2
View more presentations from gbsliebs2002.
As well here is a link to all of the answers for the worksheets in case you are unsure about how to do something. http://gbs-moodle.glenbrook225.org/moodle/mod/resource/view.php?id=1054
Well this is it for today! Good luck to everyone for tomorrow. The next scribe is Stephanie K.
Sunday, January 9, 2011
Heat of Formation
On Friday, we first started off with a Heat of Combustion lab. So basically, we added 100 mL of water into the calorimeter which is the can. We also had to mass the candle. We then quickly lit then candle and placed the calorimeter over the fire. Then we waited for the water to reach 35 celsius. Then we blew out the candle and recorded the highest temperature. Then we massed the candle once more to find out how much wax was used in the reaction. The lab is due on Tuesday with the rest of the worksheets and book problems. Ok, this is not cool. It's not letting me upload the pictures, so just look at Flickr to see the pictures of the lab.
http://www.flickr.com/photos/hc1011/5334103360/
http://www.flickr.com/photos/hc1011/5333487119/
http://www.flickr.com/photos/hc1011/5334103324/
http://www.flickr.com/photos/hc1011/5333486983/
After doing the lab, we started learning about Heat of Formation! How exciting. So basically heat of formation is the change in enthalpy that accompanies the formation of one mole of a compound from its elements. Here's a link if you want to learn more about enthalpy! http://en.wikipedia.org/wiki/Enthalpy
By the way, there was no notes sheet about this, so I'll try my best at explaining this. So there's an equation for finding the heat of formation.

So for calculating the Hf (heat of formation), you either have to look it up online, or in the chemistry text book. It's on page 209 or pg 638. Here's a table of what it looks like.
I'm pretty sure Mr. Lieberman said we don't have to memorize it. You only need to use this if it's a compound of two elements. For elements, the heat of formation in its stardard state is 0. Here's an example problem.
Calculate Delta H for reaction Kj/mole. Here's something that you should also consider. The form of the compound (example: gas, liquid, solid) matters.

So first, we find each heat of formation. The heat of formation for NH3 is (-46 kj/mole) You multiply it by 4 because in the equation, there are 4 moles of NH3. Then the heat of formation for O2 is just 0, because oxygen is is in its standard state. Then NO2 is (34 kj/mole) then multiply that by 4. Then finally, H20 is (-286 kj/mole) then multiply that by 6. So then when you multiple it out, the 6 moles of H20=-1716, 4 moles of NO2=136, O2=0, and then 4 moles of NH3=-184. You then take the products-reactants=delta H equation, so (H20+NO2)-(0+ -184)= delta H. Then your answer should equal to -1396. Remember, you always have to do products- reactants, not reactants-products.
After our notes, we had a quick discussion on rare earth metal magnets. To answer Mr. Lieberman's question "do magnets release or absorb energy when pulling them apart, or connecting them together", you have to think about it. Well, you have to use up energy when pulling apart the magnets, and then release energy to combine the magnet. Now think about this. Breaking apart two magnets is like breaking bonds which is an endothermic reaction and combining the magnets is like forming bonds which is an exothermic reaction...
It seems like we'll be learning more about this some other time. Okay, that's it for me. The homework is the pre-lab, webassign, post lab of the heat of combustion, worksheets, AND book problems. Cool. The next scribe is AnnMarie C.
http://www.flickr.com/photos/hc1011/5334103360/
http://www.flickr.com/photos/hc1011/5333487119/
http://www.flickr.com/photos/hc1011/5334103324/
http://www.flickr.com/photos/hc1011/5333486983/
After doing the lab, we started learning about Heat of Formation! How exciting. So basically heat of formation is the change in enthalpy that accompanies the formation of one mole of a compound from its elements. Here's a link if you want to learn more about enthalpy! http://en.wikipedia.org/wiki/Enthalpy
By the way, there was no notes sheet about this, so I'll try my best at explaining this. So there's an equation for finding the heat of formation.

So for calculating the Hf (heat of formation), you either have to look it up online, or in the chemistry text book. It's on page 209 or pg 638. Here's a table of what it looks like.

I'm pretty sure Mr. Lieberman said we don't have to memorize it. You only need to use this if it's a compound of two elements. For elements, the heat of formation in its stardard state is 0. Here's an example problem.
Calculate Delta H for reaction Kj/mole. Here's something that you should also consider. The form of the compound (example: gas, liquid, solid) matters.

So first, we find each heat of formation. The heat of formation for NH3 is (-46 kj/mole) You multiply it by 4 because in the equation, there are 4 moles of NH3. Then the heat of formation for O2 is just 0, because oxygen is is in its standard state. Then NO2 is (34 kj/mole) then multiply that by 4. Then finally, H20 is (-286 kj/mole) then multiply that by 6. So then when you multiple it out, the 6 moles of H20=-1716, 4 moles of NO2=136, O2=0, and then 4 moles of NH3=-184. You then take the products-reactants=delta H equation, so (H20+NO2)-(0+ -184)= delta H. Then your answer should equal to -1396. Remember, you always have to do products- reactants, not reactants-products.
After our notes, we had a quick discussion on rare earth metal magnets. To answer Mr. Lieberman's question "do magnets release or absorb energy when pulling them apart, or connecting them together", you have to think about it. Well, you have to use up energy when pulling apart the magnets, and then release energy to combine the magnet. Now think about this. Breaking apart two magnets is like breaking bonds which is an endothermic reaction and combining the magnets is like forming bonds which is an exothermic reaction...

It seems like we'll be learning more about this some other time. Okay, that's it for me. The homework is the pre-lab, webassign, post lab of the heat of combustion, worksheets, AND book problems. Cool. The next scribe is AnnMarie C.
Thursday, January 6, 2011
Endothermic Vs. Exothermic
Hey there!

Delta H stands for the energy released. That is the energy that was released by the reactant to make the product. The H stands for Enthalpy. The Delta H and q have equal values. So Delta H=q. The q stands for hea t gained (or lost). But we cannot just switch q out for Delta H in the formula (to the right)
Mr. Lieberman showed the class some magnets today and was asking about the energy transfer as they connect and as they detach. What do you think? When put together is the energy absorbed or released, and when detached is the energy absorbed or released? How can you tell? I won't answer, just think about it.

 (there's supposed to be a space between the H2O and Delta H).
The pre-lab for Heat if Combustion is due tomorrow, also there is a web assign due tomorrow as well. The worksheets are, like always, due on the last day of the chapter, which this time is the day of the quiz (1/11/11).
Alright so today in class we picked up some papers, they are The Heat of Combustion Lab, the Energy Diagram Worksheet, then finally Energy and Reactions. We also picked up some notes but we didn't go over them in class, instead Mr. Lieberman talked to us about Endothermic and Exothermic graphs. The Exothermic graph looks like this:
The reason why the products are lower is beacuse Exo means out, so the reactants lose energy. The reaction Coordinate is just the run time. The Endothermic Graph looks like this: (Ignore the Delta E it's supposed to be Delta H)
The reason why the products are higher is because Endo means in, so the reactants gain energy. The reaction is the run time. E is the amount of energy. So I bet you're wondering about the Ea and the Delta H right about now. So I'll explain them to you.
So I bet you're wondering about the Ea and the Delta H right about now. So I'll explain them to you.Ea stands for Activation enery. That means the energy used to create the product.
Delta H stands for the energy released. That is the energy that was released by the reactant to make the product. The H stands for Enthalpy. The Delta H and q have equal values. So Delta H=q. The q stands for hea
Here's the reason why.
q can be determined by an experiment: get the mass the specific heat and the temperature change and you can find q. But Delta H is theoretical, and q is actual. So you cannot find Delta H through an experiment. But one way you can find Delta t is the products (on graph) minus the reactants (on graph) no matter which type of transfer there is, it is always products minus reactants.
Mr. Lieberman showed the class some magnets today and was asking about the energy transfer as they connect and as they detach. What do you think? When put together is the energy absorbed or released, and when detached is the energy absorbed or released? How can you tell? I won't answer, just think about it.
Well I lied earlier when I said we didn't go over the notes... We went over one slide but we didn't even look at it on the projector screen. It was the last slide, the sample problem. All we did was copy down two ways to write the change of energy using a methane reaction. Here are the two ways:
The first way has the equation that was the reaction and product and to the right of the equation was the release of energy. Since the release had a negative effect (the Methane lost 890KJ) the number is a negative. But if instead of losing 890 it gained it, then the number would be positive.
The second way is to add the energy release directly into the problem. The + 890 KJ is just saying the reaction included 890 KJ of energy released.
The pre-lab for Heat if Combustion is due tomorrow, also there is a web assign due tomorrow as well. The worksheets are, like always, due on the last day of the chapter, which this time is the day of the quiz (1/11/11).
Have you figured out the questions I asked earlier? No? Google it!
The next scribe is...Lauren C.!!!! YAY!
Good Luck.
P.S. This took me a lot of time to work out (I had to redo a ton of stuff) So please like it!
Subscribe to:
Posts (Atom)